

Friday Market Update: What September Means for Northeast Tennessee
September brought different stories across the five Northeast Tennessee counties we serve. For buyers and sellers, the useful question is what is happening with homes like yours, in your price range and location.
Across Washington, Greene, Carter, Sullivan and Unicoi counties, FlexMLS Market Trends reported 507 residential closings in September, compared with 501 in August. That is six more closings, or about 1.2%. The overall pace was similar, but the county details varied.
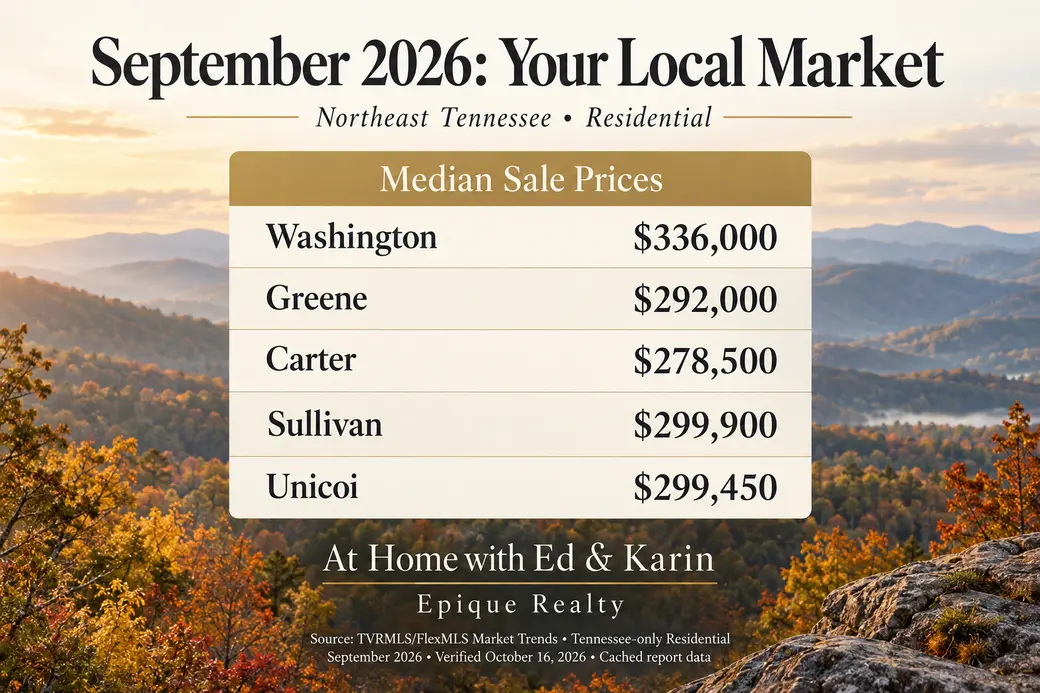
Here is a look at median sale prices—the middle price among homes sold:
-
Washington: $336,000 in September, compared with $343,000 in August; 160 closings versus 156.
-
Greene: $292,000, compared with $325,000; 64 closings versus 78.
-
Carter: $278,500, compared with $240,000; 54 closings versus 57.
-
Sullivan: $299,900, compared with $295,000; 213 closings versus 193.
-
Unicoi: $299,450, compared with $273,000; 16 closings versus 17.
These changes describe the homes that sold each month. They do not mean every home in a county gained or lost that amount of value. Smaller markets can move noticeably with just a few different sales, especially Unicoi with 16 September closings.
What this means for buyers
Allow time to compare your options. The report’s active-listing count increased in Washington, Greene, Carter and Sullivan and decreased in Unicoi. Median days on market also increased in the first four counties, while Unicoi’s median fell from 80 to 66 days.
Recent comparable sales, condition, time on market and competing listings can help shape an offer. September’s sale-to-list price ratios ranged from 95.9% to 97.5% across the five counties. Those county figures are context, not a standard discount to apply to every home, and they do not show whether sellers paid concessions.
What this means for sellers
Start with today’s competition and recent comparable sales. September’s median days on market ranged from 64 days in Washington to 83 in Carter. Build a realistic timeline, prepare the home well and review showing feedback with your agent.
A rising county median does not justify adding the same percentage to your asking price. A falling median does not establish that your home’s value fell. The right pricing conversation starts with similar properties and the choices buyers have now.
Whether you are buying, selling or planning ahead, we can help you put the local numbers in context and build a plan around your situation.
Ed & Karin
At Home with Ed & Karin | Epique Realty
Source: Tennessee Virginia Regional MLS/FlexMLS, Market Trends Graphs, August–September 2026. Each county was filtered separately to Tennessee and Residential, with no price limits. Figures checked October 16, 2026. FlexMLS reports use cached data, so later updates may change results. Regional closings are the sum of the five county report rows. Days on market uses DOM, not cumulative DOM. Sale-to-list ratios use the report’s Sale to List Price Ratio.
Categories
Recent Posts








GET MORE INFORMATION